At PushEngage, you can choose from multiple Web Push Opt-in. You can even choose different opt-in for desktop and mobile. You can configure various options like color, position, delay, type of pop-up for configuring your subscription.
However, we need to understand each of the push opt-in templates are different. One type of opt-in may work for one website and other types would work for other sites. To understand which push opt-in is best for your site, you can check out the detailed Push Notification Opt-In Analytics report. Funnel analytics provides push notification statistics which helps in improving the Push Notification Opt-In rate.
With Push Opt-in Analytics, you will get the complete picture of how your opt-in is performing. You can then analyze the data and see which one works better. Many times users do not click on your notifications and want to unsubscribe. PushEngage offers a feature to enable an easy way to unsubscribe from Web Push Notification.
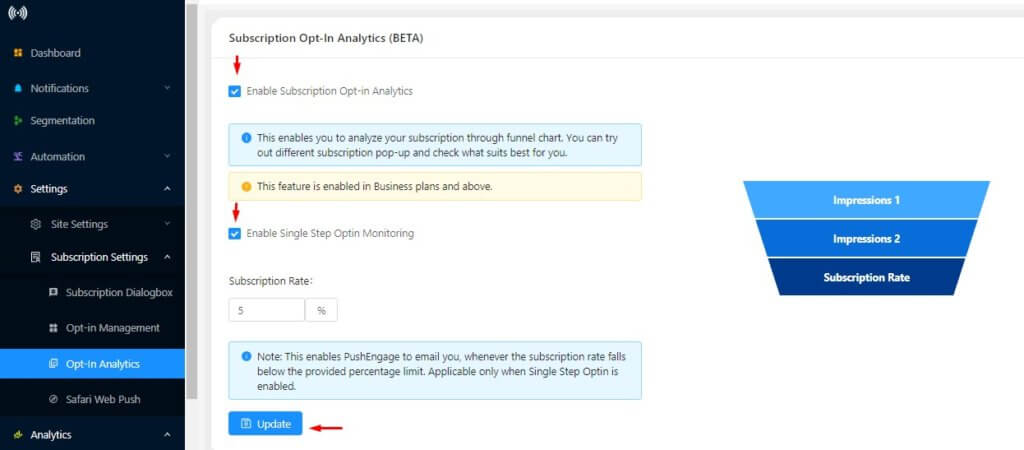
To gather this data, go into your settings and enable the gathering of this data under Settings > Subscription Settings > Opt-In Analytics.
Check the button to enable subscription opt-in analytics and click on update.
How To Understand The Push Notification Opt-In Analytics Report?
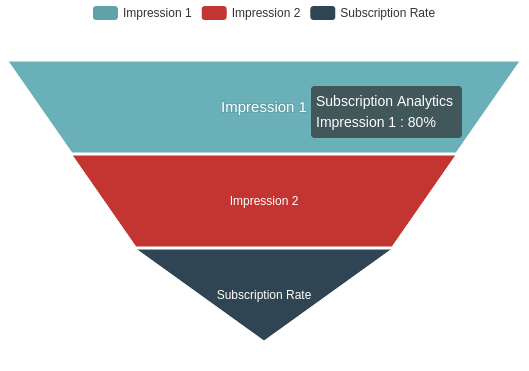
Push Notification Opt-In works like the marketing funnel. First, we need to see how many times your opt-in appears. This is the top funnel. Next is the second impression which is the intermediate page. Note, in HTTPS sites, you don’t need an intermediate page or pop-up, and can skip this step.
Once the user sees the opt-in, he has two options – Allow or Block. If he allows he will see the intermediate page. The third and last important thing is subscription. In the intermediate page, if the user “Allows” notification, he will be subscribed to the notification. Below image will give you a clearer idea:
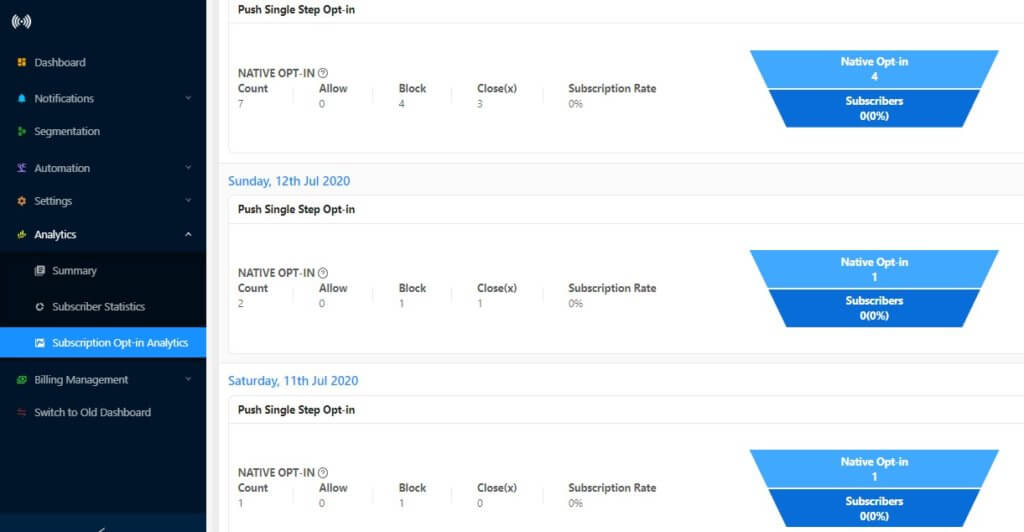
To view the analytics report, go to Analytics > Subscription Opt-in Analytics. To get a better understanding, check the below sample analytics report:
Meaning of each section of the report:
- Subscription Opt-in Type: At PushEngage, you can choose from 7 different types of opt-in depending on the site type. This column shows which type of push opt-in type you have chosen.
- Site Type: This shows the site type of your website. It could be either HTTP or HTTPS websites.
- First Impression: This shows the 1st impression of your push opt-in. When a user comes to your website, the push opt-in appears on the page. This is called the 1st impression of the opt-in.
- Second Impression: In two-step opt-in, you have an intermediate image after the user clicks on “Allow”. This is the second impression of your push opt-in. In the case of single-step opt-in, you don’t have the second impression
- Subscribers: This is the count of total subscribers who subscribed under this specific Subscription opt-in type.
- Subscription Rate: It is the opt-in rate for the Subscription Opt-in Type you have selected for your website.
How To Use The Push Notification Opt-in Analytics Report
First, you have to configure your opt-in type. Go to Subscription Dialog Box Settings under settings. Choose any type of Opt-In type and configure the push opt-in.
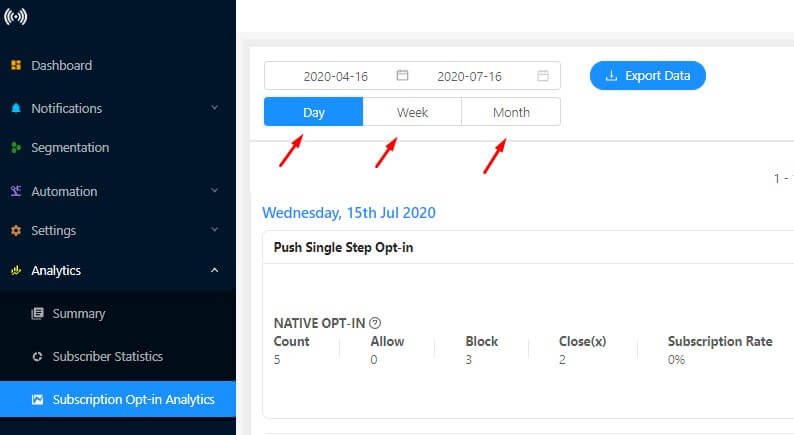
Next, see the subscription rate for that opt-in type in your report. You can select see the report day/week/month wise. After a couple of days or a week, change the opt-in type and see the opt-in rate.

In this way, you can verify which of the opt-in type is giving you a higher push opt-in rate. Use that opt-in type for your website. You can go further and change:
- Placement of the opt-in
- Content of the opt-in
- Name of the button
- Color of the text and button
See the analytics report to find out which is giving your better result.


