Welke Omnichannel E-commerce Statistieken Echt Belangrijk Zijn
Before you pick a tool, you need a framework. Here are the metrics a complete omnichannel measurement stack should cover.Omzet & Attributie
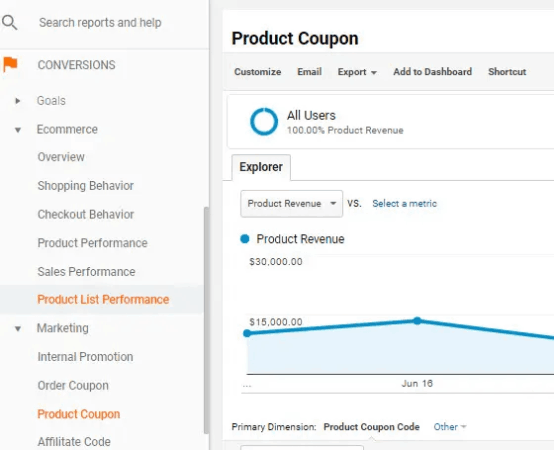
- Omzet per kanaal — Hoeveel heeft elk kanaal (zoek, social, e-mail, push, direct) bijgedragen aan voltooide bestellingen? Dit is de basis voor elke beslissing over kanaalinvesteringen.
- First-touch vs. last-touch vs. multi-touch attributie — Welk kanaal krijgt de eer voor de verkoop? Last-touch geeft e-mail of betaald zoeken veel valse eer. Multi-touch modellen (lineair, tijdverval, datagedreven) verdelen de eer eerlijker.
- CAC per kanaal — Klantacquisitiekosten per kanaal. Het kennen van uw gecombineerde CAC verbergt de kanalen die marge verspillen.
Retentie & Loyaliteit
- Herhaalaankoopratio — Het percentage klanten dat opnieuw koopt binnen 90 of 180 dagen. Dit is het retentiecijfer dat duurzame bedrijven scheidt van bedrijven die vastzitten op de acquisitieloopband.
- Klantlevenslange waarde (LTV) — Totale omzet van een klant gedurende hun volledige relatie met uw winkel. De LTV:CAC-ratio vertelt u of uw acquisitie-uitgaven daadwerkelijk de moeite waard zijn.
- Churn rate — Het tempo waarin kopers inactief worden. Een hoge churn betekent dat uw retentiekanalen niet genoeg werk verrichten.
Betrokkenheid & Kanaalprestaties
- E-mail open rate / CTR — Industriële benchmarks voor e-commerce schommelen rond de 15-20% open rates, maar uw cijfers op segmentniveau zijn belangrijker dan gemiddelden.
- Pushmelding CTR en conversieratio — Web push levert doorgaans significant hogere betrokkenheid op dan e-mail per levering, met doorklikratio's die gemiddeld 7% bedragen voor goed gesegmenteerde campagnes. Volg dit per campagne, niet alleen in totaal.
- Opt-in-percentage — Welk percentage van uw websitebezoekers abonneert zich op elk eigen kanaal? Een laag opt-in-percentage is een conversieprobleem voordat het een retentieprobleem is.
- Leveringspercentage — Vooral relevant voor push en SMS, waarbij leveringsfouten duiden op technische problemen of abonneeverloop.
eCommerce-specifiek
- Gemiddelde Orderwaarde (AOV) — De gemiddelde transactiegrootte. Segmenteer AOV per acquisitiekanaal om te ontdekken welke bronnen kopers versus browsers aantrekken.
- Winkelwagenverlatingspercentage — Het gemiddelde in de branche ligt rond de 70%. Uw percentage ten opzichte van die benchmark vertelt u hoeveel inkomsten uw retentiekanalen kunnen terugwinnen.
- Return on Ad Spend (ROAS) — Voor betaalde kanalen, de gegenereerde inkomsten per uitgegeven dollar. Essentieel voor budgetbeslissingen voor betaalde social media en zoekopdrachten.
De 10 beste tools voor het volgen van omnichannel eCommerce-statistieken
1. Google Analytics 4 (GA4)
What it tracks: Cross-channel traffic, events, conversions, revenue attribution, funnel analysis, user journeys, and predictive audiences. Who it’s for: Every eCommerce store — it’s the non-negotiable analytics foundation. Strength: GA4’s event-based model and cross-device reporting make it the most complete free picture of how users move across your site and channels. Data-driven attribution is now available on most properties. Limitation: Out-of-the-box reports can be hard to read for non-analysts; the default attribution window is shorter than most LTV measurement needs. Pricing: Free (GA4 360 for large enterprises at custom pricing).2. MonsterInsights
What it tracks: GA4 data surfaced directly inside WordPress — eCommerce revenue, top products, conversion funnels, affiliate link clicks, form submissions, and custom dimensions — without requiring you to touch GA4’s interface. Who it’s for: WordPress and WooCommerce stores that want GA4 insights without leaving their dashboard. Strength: The MonsterInsights plugin removes the GA4 learning curve almost entirely. Enhanced eCommerce tracking installs in minutes, not days. Limitation: Dependent on GA4 as the underlying data source — doesn’t add new data collection, just makes GA4 more accessible. Pricing: Free tier available; paid plans start at $99.50/year.3. Triple Whale
What it tracks: Paid ad attribution, blended ROAS, pixel-based first-party data, customer journeys, cohort LTV, and Shopify revenue by channel. Who it’s for: Shopify merchants with significant paid social spend (Meta, TikTok, Google) who need better attribution than platform-native reporting. Strength: Triple Whale’s Pixel reconciles platform-reported conversions against Shopify-confirmed orders, which gives you a much more honest picture of ROAS across Meta and Google — especially post-iOS 14. Limitation: Primarily built for paid channel attribution; organic, push, and email channels get lighter treatment. Pricing scales with revenue. Pricing: Starts around $129/month for Shopify stores; custom pricing at higher GMV.4. Northbeam
What it tracks: Multi-touch attribution across paid and organic channels, LTV by acquisition source, media mix modeling, and real-time ROAS. Who it’s for: Mid-market and enterprise eCommerce brands running complex multi-channel paid programs. Strength: Northbeam’s media mix modeling handles iOS 14+ signal loss better than most, giving large paid programs a more reliable ROAS picture than platform-native dashboards. Limitation: Significant onboarding investment and price point puts it out of reach for smaller stores. Pricing: Custom; typically $1,000+/month.5. Klaviyo
What it tracks: Email and SMS revenue attribution, subscriber engagement, flow performance, segment-level LTV, A/B test results, and predictive analytics including predicted LTV and churn risk. Who it’s for: eCommerce stores running email and SMS programs who want channel-level revenue attribution in one tool. Strength: Klaviyo’s predictive LTV and churn-risk scoring are genuinely useful for segmenting your highest-value subscribers before they go cold. Limitation: Klaviyo measures email and SMS well, but doesn’t see the full picture for channels it doesn’t own (search, paid, push). Pricing scales with list size, not activity — a large cold list costs real money. Pricing: Starts free (up to 250 contacts); scales to hundreds of dollars per month as lists grow.6. PushEngage
What it tracks: Push notification campaign performance (CTR, conversion rate, revenue per campaign), goal tracking and revenue attribution per workflow, per-channel opt-in rates, subscriber growth and churn, A/B test results, and engagement metrics across web push, app push, and WhatsApp. Who it’s for: eCommerce merchants who want to measure the retention channels they own — web push, mobile app push, and WhatsApp — and connect those channels directly to attributed revenue. Strength: PushEngage’s goal tracking feature closes the loop between a push notification click and a completed purchase, giving you campaign-level revenue attribution for your retention channels. If you’re running cart abandonment, browse abandonment, or price-drop workflows, you can see exactly how much revenue each workflow recovered — not just clicks. For a broader look at how multi-channel retention fits into your eCommerce engagement strategy, the goal tracking data anchors the ROI math. Limitation: PushEngage measures its own channels (web push, app push, WhatsApp) with depth. For attribution across paid, search, and email, you’ll combine it with GA4 or a dedicated attribution tool. Pricing: Free tier available (1 site, 200 subscribers, 30 campaigns). Paid plans start at $14/month (Business) with goal tracking available on the Premium plan at $29/month.7. Veeqo
What it tracks: Inventory levels across warehouses and sales channels, order management, fulfillment performance, shipping costs, and stock-out risk by channel and SKU. Who it’s for: Multi-channel merchants selling across Amazon, Shopify, eBay, and direct-to-consumer who need inventory and order data in a single view. Strength: Veeqo solves a blind spot that pure analytics tools miss entirely — you can’t measure omnichannel revenue accurately if your inventory and order data is siloed by platform. Veeqo syncs across channels so your numbers match reality. Limitation: It’s primarily an operations and inventory management tool, not a marketing analytics platform. Revenue attribution across channels still requires GA4 or a dedicated attribution solution. Pricing: Free for up to a certain monthly order volume (acquired by Amazon).8. Segment (Twilio)
What it tracks: Customer data collection and routing — it’s a customer data platform (CDP) that captures events from your web, mobile, and server-side sources and routes them to any downstream tool (analytics, CRM, email, push, ads). Who it’s for: Mid-market and growing eCommerce brands that have data fragmented across multiple tools and want a single customer identity across channels. Strength: Segment solves the root cause of most omnichannel measurement problems: the same customer appearing as different people across your analytics, email, and push tools. A unified customer profile makes every downstream metric more accurate. Limitation: Segment is infrastructure, not a reporting layer — analytics and attribution tools still sit on top. Implementation requires developer time. Pricing: Free tier (up to 1,000 monthly tracked users); paid plans start around $120/month.9. Hotjar / Microsoft Clarity
What it tracks: On-site user behavior — heatmaps, session recordings, click maps, scroll depth, and funnel drop-off by page. Who it’s for: Any eCommerce store trying to understand why users aren’t converting, not just that they aren’t. Strength: Qualitative behavioral data fills a critical gap. Knowing that most users who click a push notification drop off on the product page is actionable in a way a bare conversion rate isn’t. Limitation: Behavioral tools are diagnostic, not attributive — they don’t tie on-site behavior to cross-channel revenue attribution. Pricing: Hotjar has a free tier; paid plans start at $32/month. Microsoft Clarity is free.10. Looker Studio (voorheen Google Data Studio)
What it tracks: Nothing on its own — it’s a free data visualization and reporting layer that connects to GA4, Google Ads, Search Console, Shopify, and dozens of other data sources via connectors. Who it’s for: Any team that needs to pull omnichannel data from multiple sources into a single dashboard view. Strength: Looker Studio lets you build a cross-channel dashboard that puts GA4 revenue data next to your push notification CTRs, paid ROAS, and email performance without paying for a BI tool. For eCommerce teams tracking the full range of growth-driving tools, it’s often the connective tissue that makes the stack readable. Limitation: Looker Studio is a reporting layer, not an analytics engine. It surfaces data from other tools but doesn’t analyze or attribute it. Pricing: Free.
Vergelijkingstabel
| Gereedschap | Primaire Categorie | Het Beste Voor | Belangrijkste Metriek Die Het Ontgrendelt | Startprijs |
|---|---|---|---|---|
| GA4 | Webanalyse | Alle winkels | Cross-channel attributie | Gratis |
| MonsterInsights | GA4 voor WordPress | WP/WooCommerce | eCommerce-omzet in WP-dashboard | €99,50/jaar |
| Triple Whale | Betaalde attributie | Shopify + veel betaalde social | Eerlijke ROAS na iOS 14 | ~$129/maand |
| Northbeam | Multi-touch attributie | Betaalde programma's voor de middensegmenten | Media mix ROAS | Aangepast (~$1K+/maand) |
| Klaviyo | E-mail/SMS-analyse | E-mail-eerst retentieprogramma's | Voorspellende LTV + churnrisico | Gratis niveau; schaalt |
| PushEngage | Push/retentieanalyse | Web push, app push, WhatsApp | Attributie van omzet per campagne | Gratis niveau; vanaf € 14/maand |
| Veeqo | Voorraad & bestellingen | Multichannel-activiteiten | Cross-channel voorraadnauwkeurigheid | Gratis |
| Segment | CDP / data-routering | Gefragmenteerde klantgegevens | Geünificeerde klantidentiteit | Gratis niveau; ~$120/maand |
| Hotjar / Clarity | Gedragsanalyse | On-site CRO | Inzicht in sessie-afhakers | Gratis / $32+/maand |
| Looker Studio | Datavisualisatie | Cross-tool dashboards | Geünificeerd omnichannel rapportageoverzicht | Gratis |
Hoe bouw je een praktische omnichannel meetstack
You don’t need all ten tools. You need the right layers. The foundation layer: GA4 + MonsterInsights (or GA4 direct) Start here. GA4 is the baseline for traffic, conversion, and revenue attribution across channels. If you’re on WordPress or WooCommerce, MonsterInsights delivers most of that value without the GA4 learning curve. Set up eCommerce tracking, configure conversion events, and make sure your UTM parameters are consistent across every channel before you add anything else. The retention channel layer: PushEngage Once your GA4 baseline is solid, you need measurement for the channels that bring customers back — not just the channels that acquire them. Web push, app push, and WhatsApp live outside GA4’s native view unless you instrument them correctly. PushEngage’s goal tracking connects push notification clicks to completed purchases, so you can see which retention workflows are generating revenue and which ones are just burning subscriber goodwill. If you’re not sure what effective retention channel campaigns look like before you set up measurement, browsing push notification examples by use case gives you a benchmark for what good campaign performance looks like. The attribution layer: Triple Whale or Northbeam (if you run paid) If you’re spending meaningfully on Meta, TikTok, or Google Ads, platform-reported ROAS flatters you. Add Triple Whale (Shopify-first, accessible pricing) or Northbeam (more sophisticated, higher price point) to reconcile platform claims against actual confirmed orders. The behavioral layer: Hotjar or Microsoft Clarity Add one behavioral tool once your quantitative measurement is in place. The qualitative data — why users drop off on your product page after clicking a push notification — gives your optimization work direction. The unified view: Looker Studio When your stack has three or more data sources, build a Looker Studio dashboard. Pull GA4 revenue, PushEngage push performance, Klaviyo email data, and paid ROAS from Triple Whale into one view. That’s the omnichannel dashboard that makes weekly reporting manageable. For a deeper look at how these tools fit into a complete growth stack, see essential eCommerce business tools for a broader framework.
Veelgestelde vragen
Wat is de belangrijkste omnichannel e-commerce metric om te volgen?
If you can only pick one, track repeat purchase rate. It tells you whether your retention channels — email, push, SMS, WhatsApp — are working. A store with a 30%+ repeat purchase rate within 90 days is building an LTV foundation that makes every acquisition dollar go further.Heb ik een CDP zoals Segment nodig om omnichannel metrics te volgen?
Not at the start. GA4 plus consistent UTM tagging gets most stores a long way. A CDP becomes valuable when the same customer shows up as a different person across your email, push, and analytics tools. If your stack is small and tightly integrated, save the Segment implementation until the fragmentation problem is real.Hoe past pushmelding analytics in een omnichannel meetstrategie?
Push notification analytics — specifically goal tracking — connects your retention channels to the revenue they directly generate. Without it, you know your push campaigns get clicks, but you don’t know if those clicks convert to orders. Tools like PushEngage track the full journey from push click to completed purchase, which means you can measure push-attributed revenue the same way you measure email-attributed revenue.Kan ik omnichannel statistieken volgen zonder een grote tech-stack?
Yes. GA4 (free) + MonsterInsights ($99.50/year) + PushEngage (free tier available) gives you cross-channel analytics, WooCommerce revenue tracking, and retention-channel attribution for under $150/year. That’s a workable measurement foundation. Add attribution tools and a CDP as paid spend and data volume grow.