Bemærk: Der findes ingen ældre dokumentation tilgængelig for dette element, så du ser den aktuelle dokumentation.
The analytics section can give you an idea about the trends of your campaigns, subscribers statistics & region. We have various options to help you understand your subscriber’s data. This article will help you understand the analytics of push campaigns.
Three different options can help you understand subscriber summary –
- Overview
- Opt-in Analyse
- Abonnenter
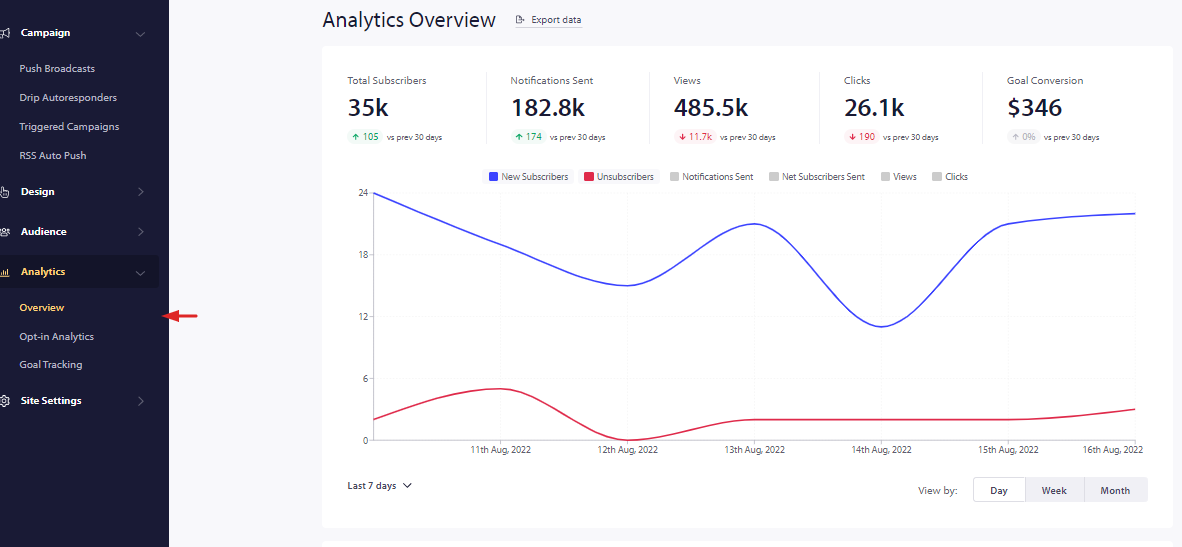
Overview
Each site has its overview or summary of analytics. This can be seen under Analytics > Overview.
Here you can see details of subscribers collected, unsubscribed, and campaigns seen, daily, weekly, or monthly clicks between a given date range.
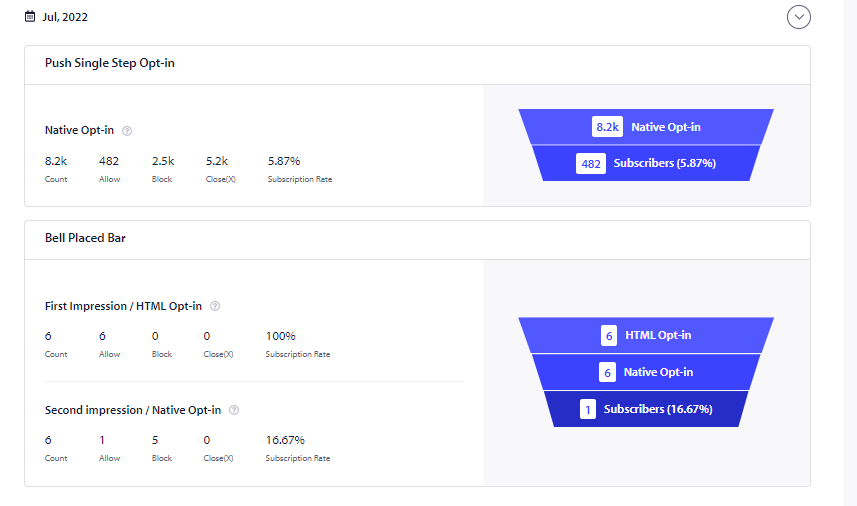
Opt-in Analyse
This gives a drill-down analysis of the subscription rate. How many people saw the pop-up, people who clicked on allow or block along with subscription rate of pop-up dialog box selected.
You will have to enable Opt-in Analytics by navigating to Audience > Opt-in Analytics > Settings in the top-right corner.
Enable the tracking. It is not important to enable single-step monitoring or add an alert for subscription rate downfall. It is an optional feature to use based on your requirements.
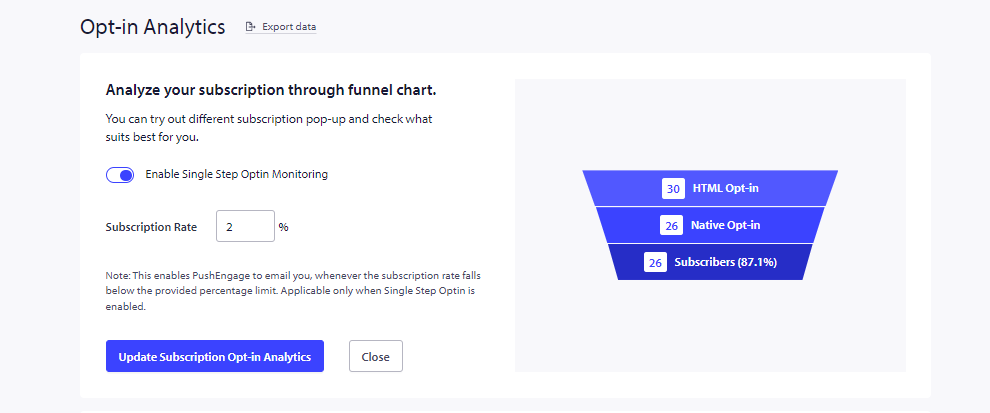
Once you have enabled then you can check the details under Analytics > Opt-in Analytics.
You can see a funnel view of the opt-in performance. It gives a holistic view of people who clicked on allow, block or close. It also includes the analytics of the recovery widget – ‘Get notification widget’, which means people who opted in through this method. You can see this data in daily, weekly & monthly views.
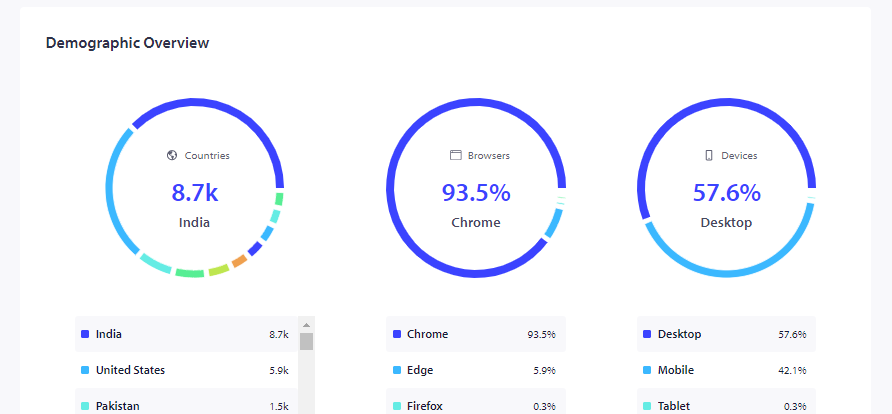
Abonnenter
This helps you understand the demographics of a subscriber. You can navigate to Audience > Subscribers.
You can see the subscriber’s summary with countries, browsers and devices along with new subscribers added and unsubscribed summary.
Hvis du støder på problemer, er du velkommen til at kontakte os ved at klikke her. Vores supportteam vil kunne hjælpe dig.


