注意:此项目没有可用的旧版文档,因此您看到的是当前文档。
Adding a chat widget is just the first step. To optimize customer conversations and drive more leads, you need visibility into how visitors interact with your widget.
PushEngage Chat Widget Analytics helps you track engagement across all enabled channels in one place. From understanding which messaging platforms your visitors prefer to identifying peak interaction times, analytics gives you actionable insights to refine your communication strategy, improve response rates, and maximize conversions.
With clear, easy-to-read metrics, you can move beyond guesswork and make data-driven decisions to get the most value out of your on-site chat widget.
Log in to the PushEngage Dashboard and navigate to Chat Widgets
You can click on the Analytics Overview page.
This analytics overview helps in providing details of total interactions, clicks, and CTR.
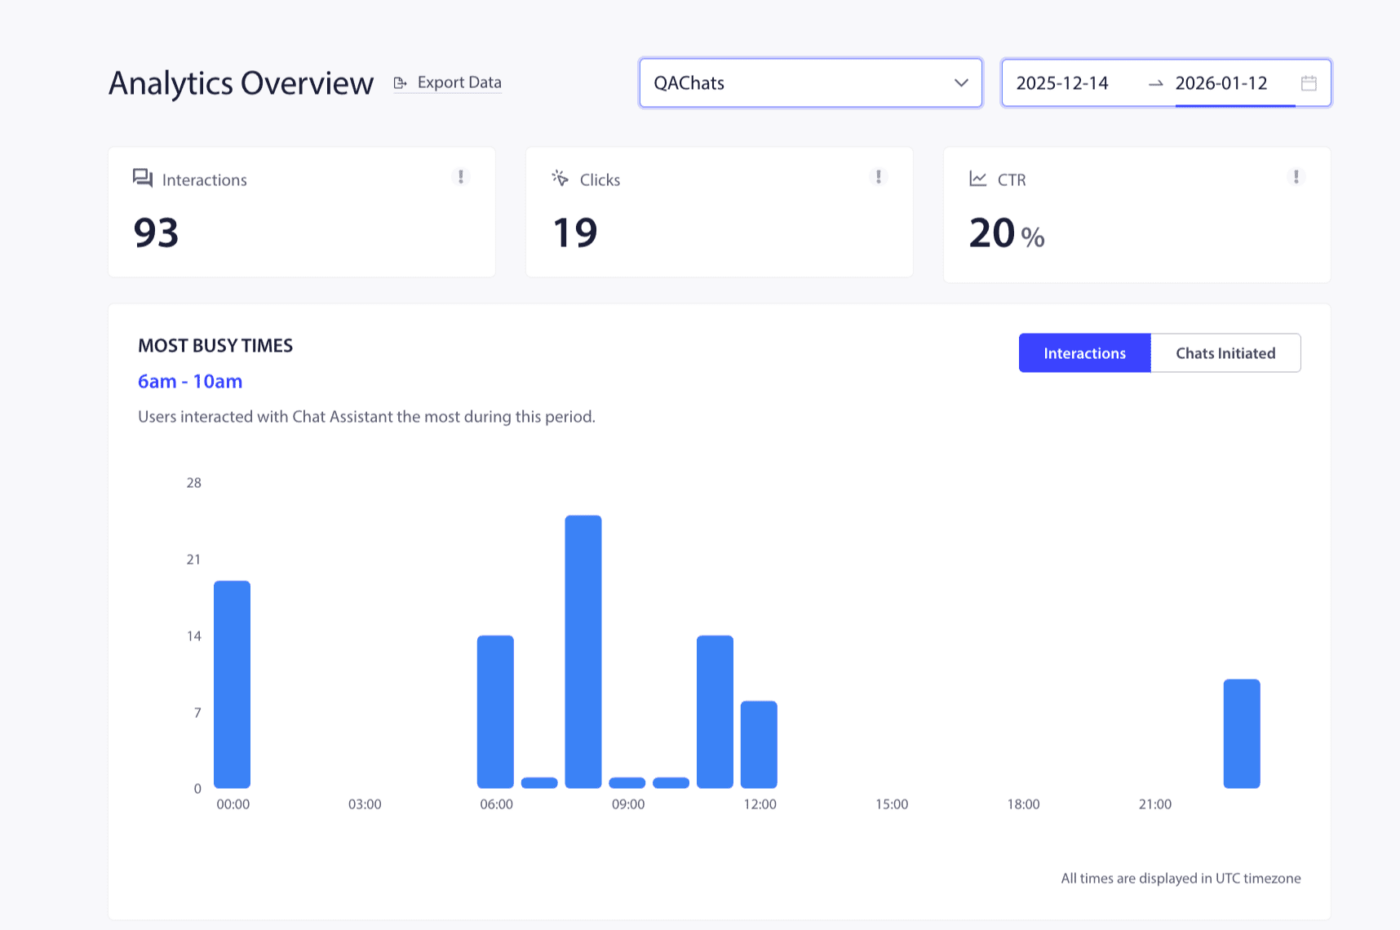
You can see a breakdown of the ‘Most Busy Times’ based on chat initiations and interactions. You can plan your agents and channel availability according to these details.
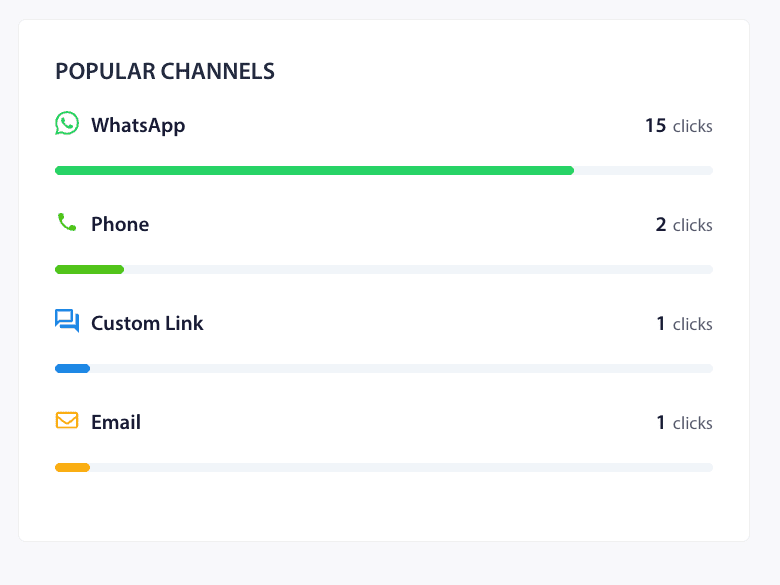
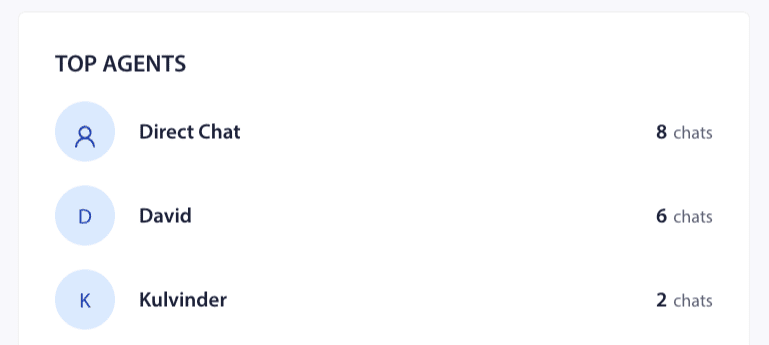
You can also see the distribution of Top Agents & Popular Channels on this screen. This way, your traffic or customer attribution can be measured.
You can also assign different agents and see every individual agent’s performance so you can see who the better performing agents are in your team.
If, in case, you run into any issues, please feel free to contact us by clicking here. Our support team would be able to help you.


